A Chan theory indicator system—automatic K-line structure parsing for precise market reading.
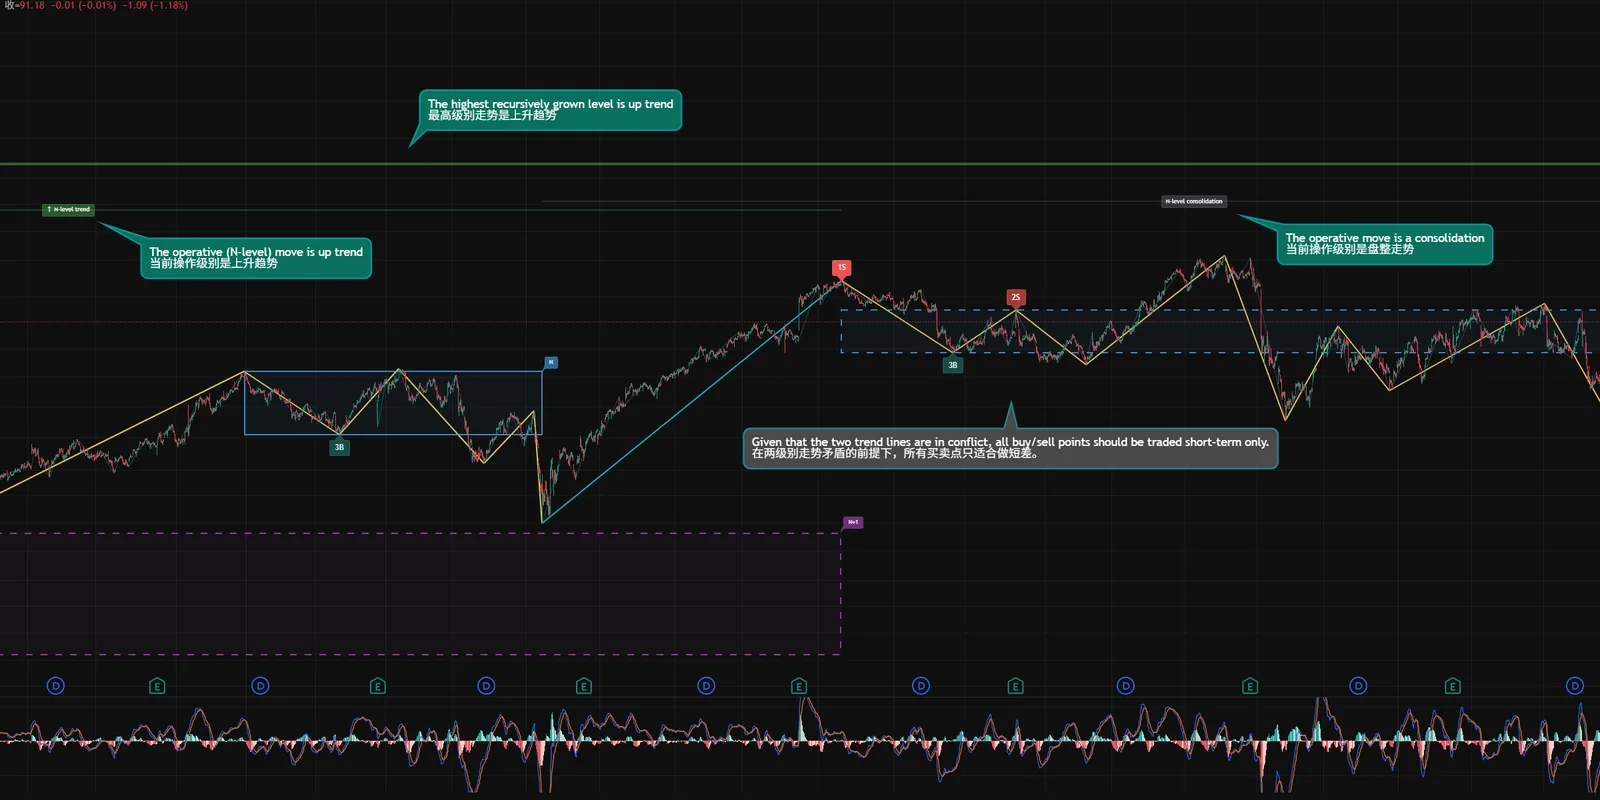
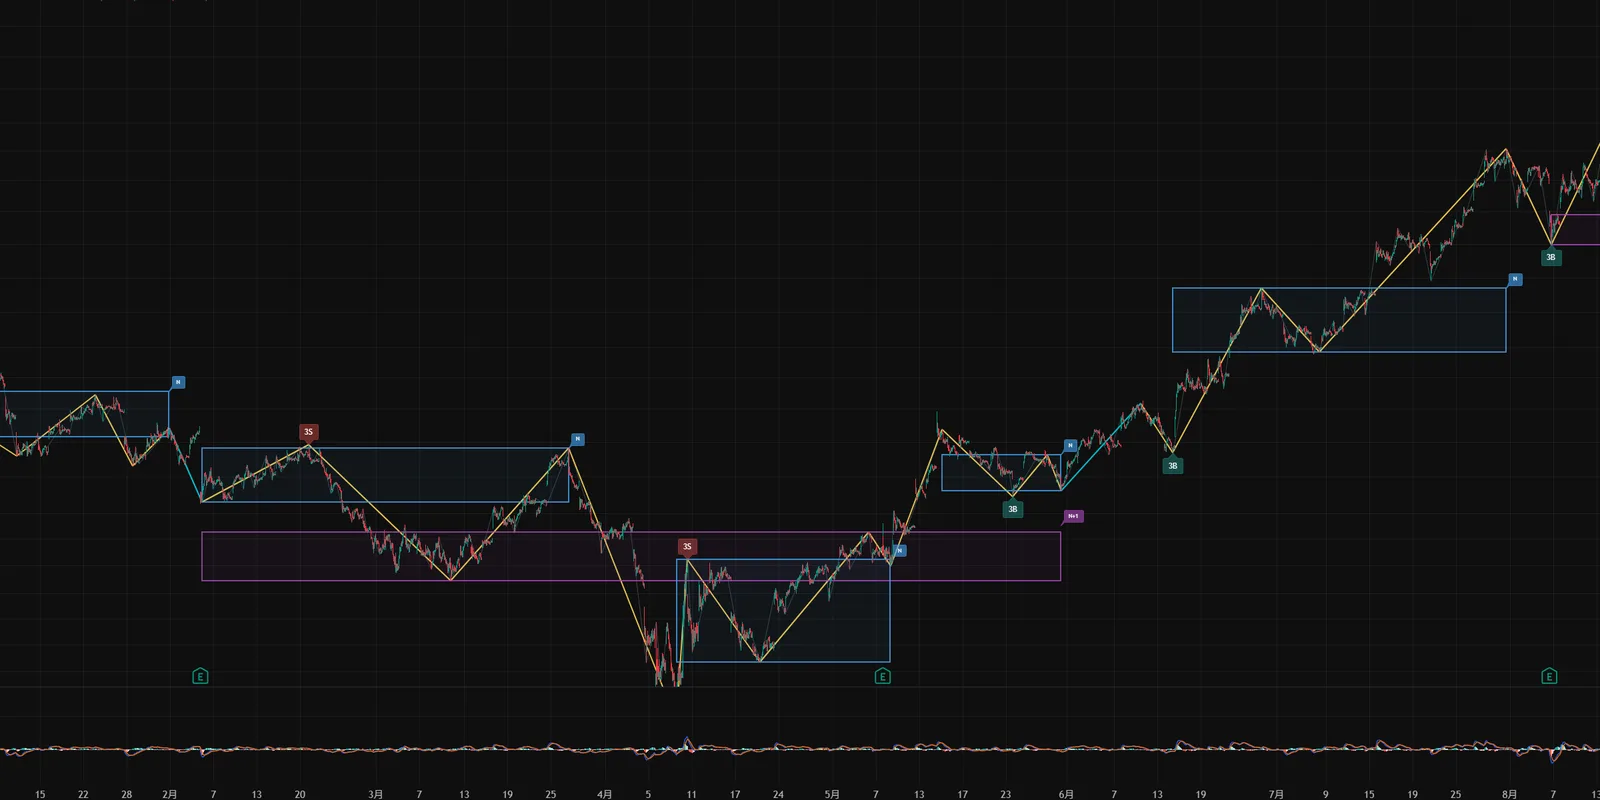
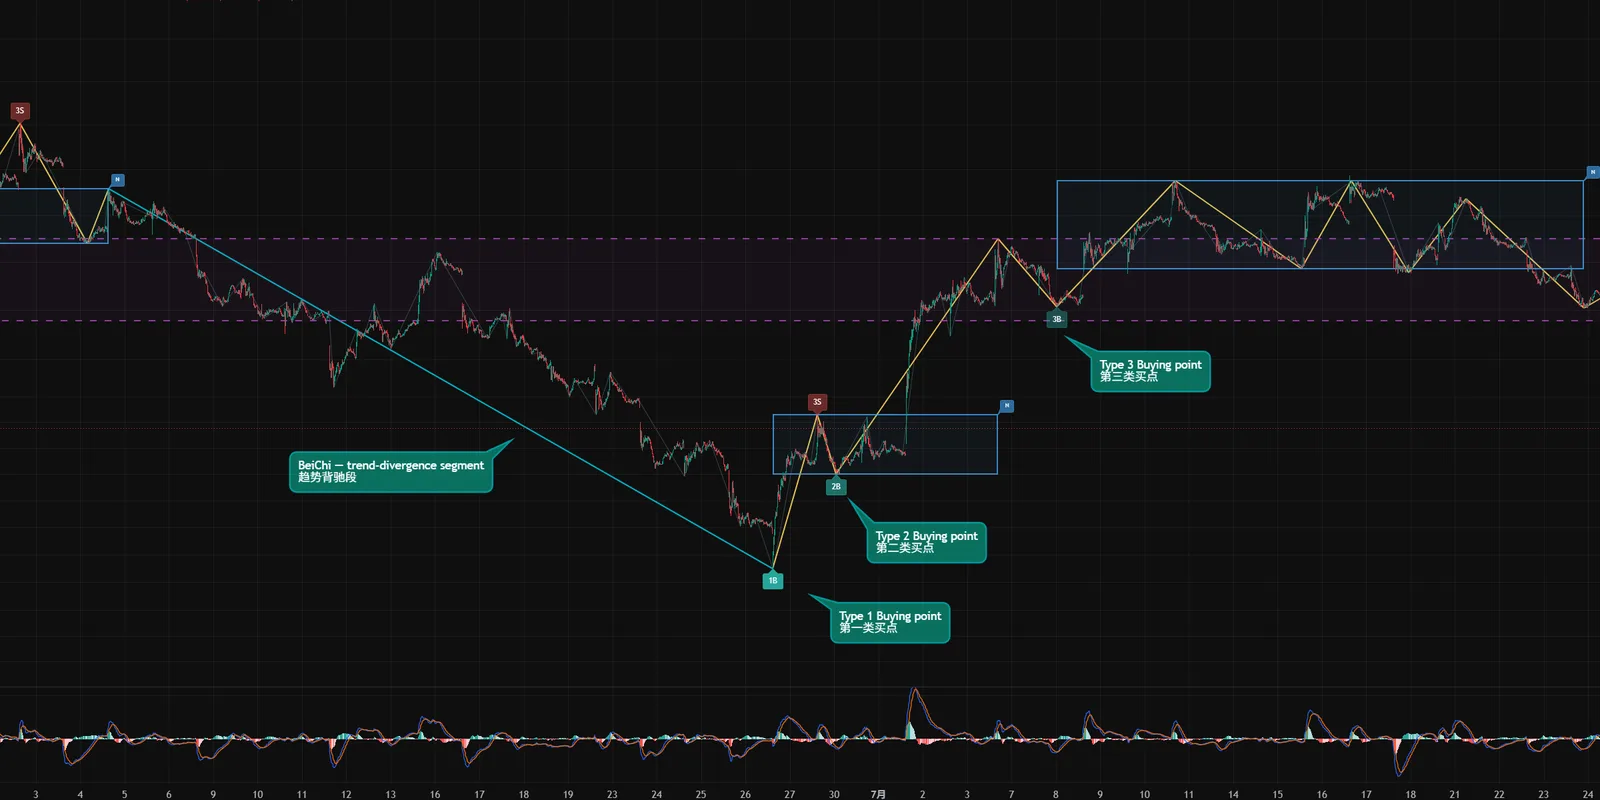
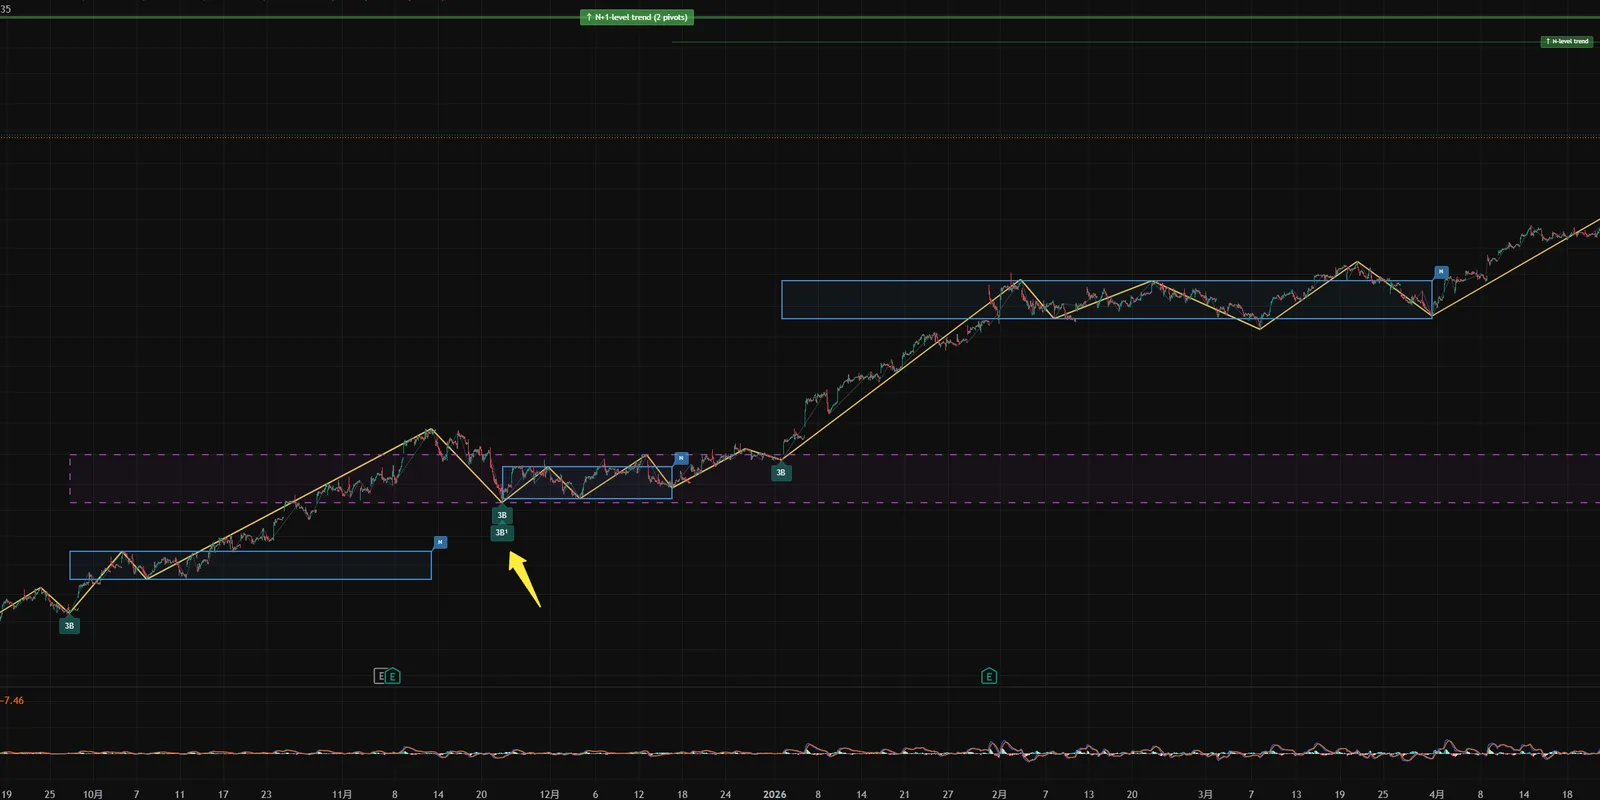
What the system solves
Should you act now?
Trend or range? If it is a trend, which stage is it in? If it is a range, where are the boundaries?
Where to act and where to exit
Precise entry and exit points—not “somewhere in this area”, but this bar and this price.
When to admit a wrong read
After entry, when price does not move as expected, when can you say the read is wrong and stop out?
Traditional technical analysis—moving averages, patterns, common indicators—cannot answer these three deterministically. They are probabilistic, subjective and after the fact.
A complete classification of market states
Chan theory classifies every move with pivots: a trend contains two or more same-direction pivots, while a consolidation contains one. There is no third case. For any bar, you can state what structure it is in—no guessing, no gut feel.
Precise definitions of buy/sell points
The three types of buy/sell points each have strict conditions: Type 1 is the turn after trend divergence, Type 2 is the retest after Type 1, and Type 3 is the pullback that does not re-enter the pivot after a breakout. Either the condition is met or it is not.
Divergence is a quantified comparison of strength
Divergence is not a vague “the MACD bars shrank”. It is a strength comparison between two same-direction moves. When strength weakens, divergence forms—and divergence forces a turn.
| Trading need | System provides |
|---|---|
| Trend or range right now? | Trend-type blocks plus pivot boxes, readable at a glance |
| Which stage is the move in? | Pivot labels (extending / upgraded / terminated) + segment counts |
| Where to buy and where to sell | 1B/2B/3B and 1S/2S/3S labels printed directly on the chart |
| How much further can the move go? | Divergence detection plus pivot-range extension lines as targets |
| When do you admit you are wrong? | Invalidation is explicit: after a third buy, falling back into the pivot voids it; if divergence is not confirmed, the move continues. |
Manually analysing one 30-minute chart takes thirty minutes to an hour and is easy to get wrong or bias. Chan theory gives precise answers; this system draws those answers on the chart—no hand calculation, just read the structure.
Features
Everything the indicator draws on a chart, item by item.
Fractal labels
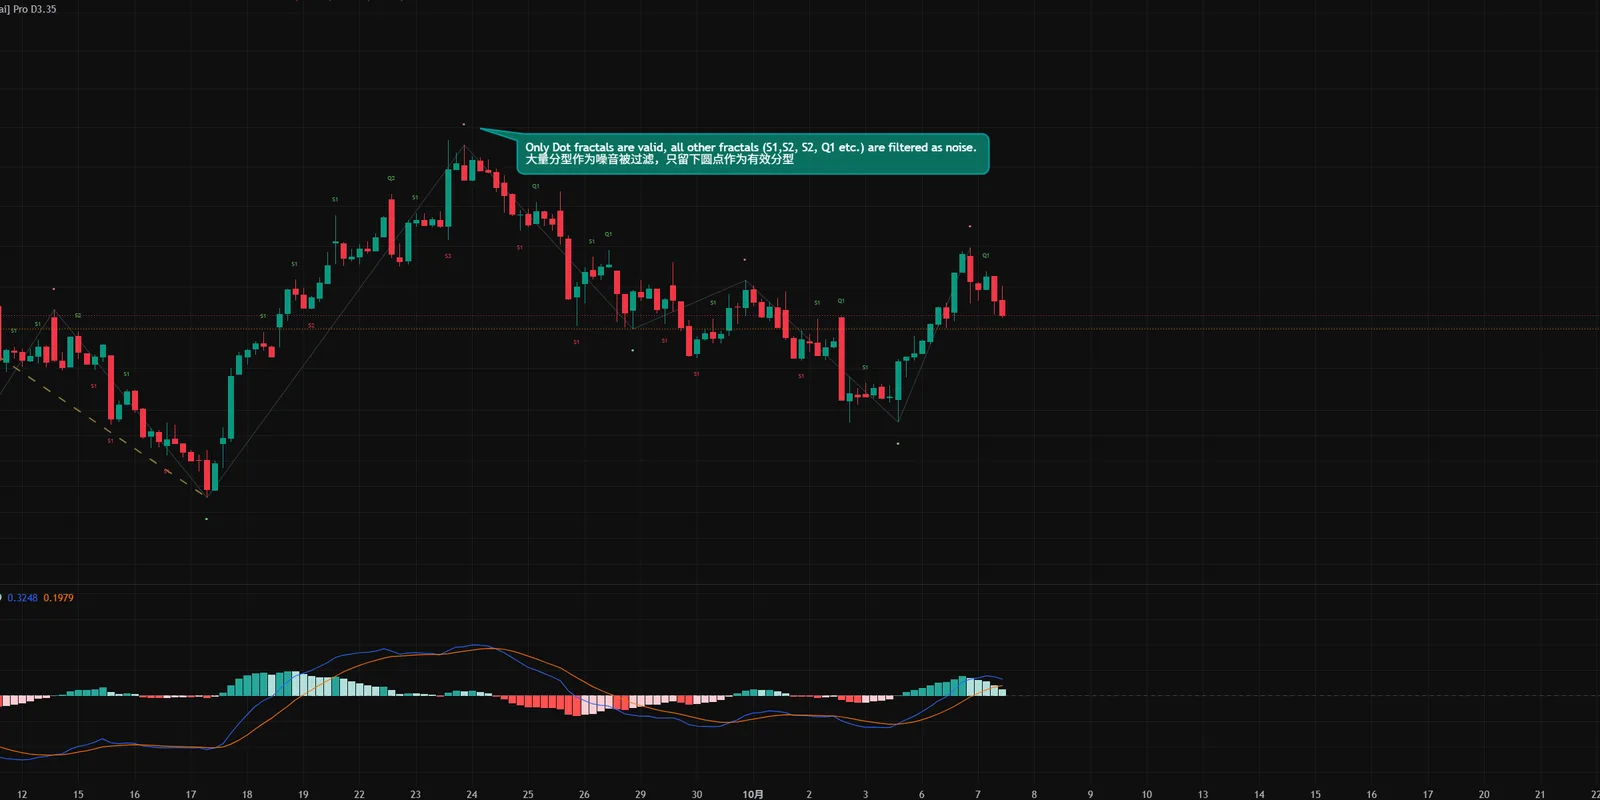
Valid top and bottom fractals after multi-rule filtering are marked with two-colour dots and can be toggled independently.
Stroke and segment drawing
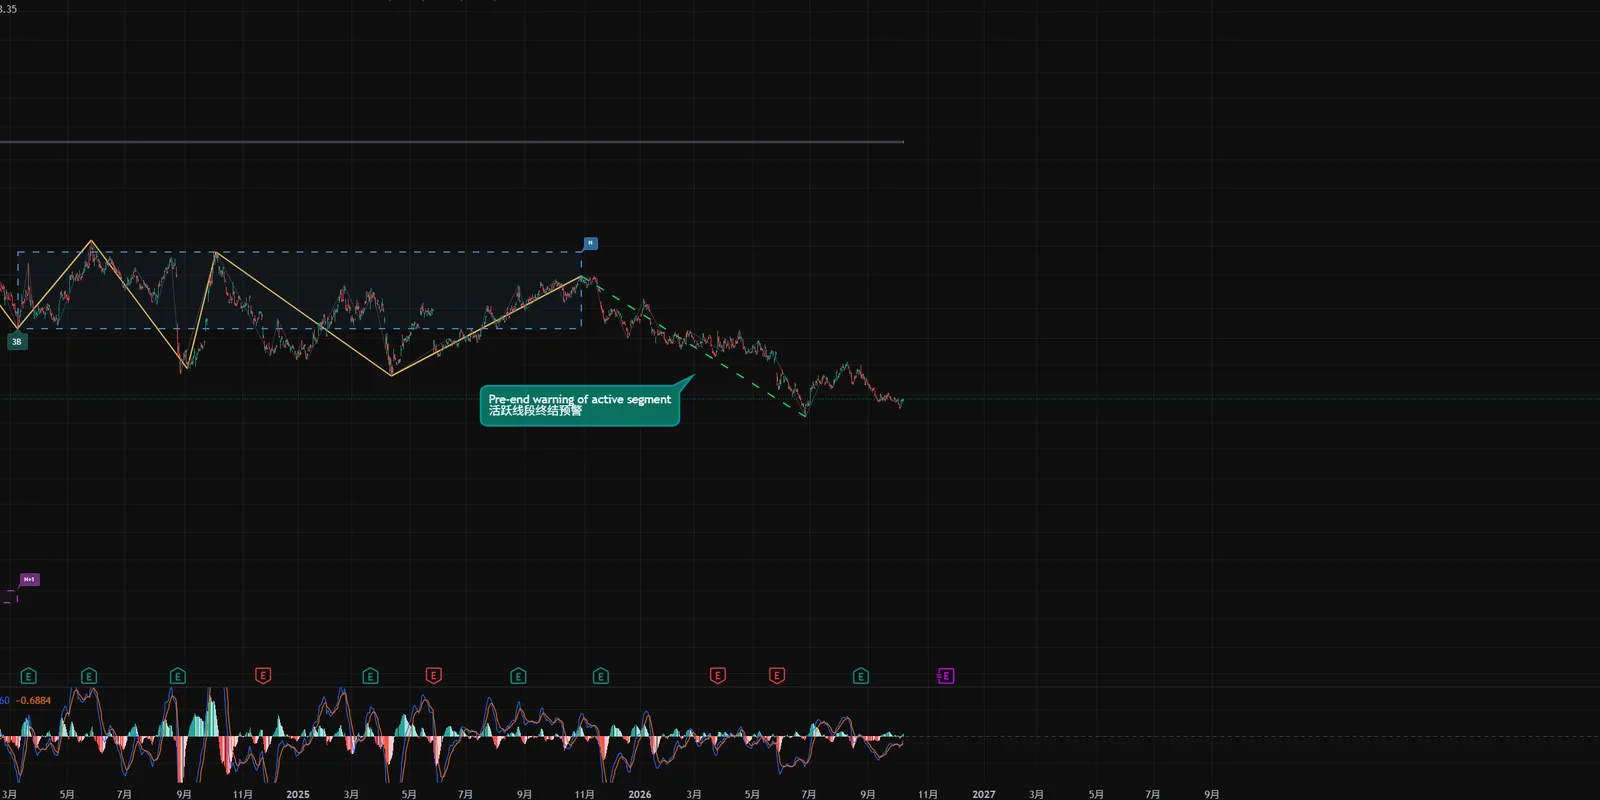
Strokes and segments are drawn strictly by the definitions. Segment termination uses the feature-sequence fractal rule, with both gap and no-gap cases handled—no hand drawing.
Multi-level pivot detection
Pivots from level N to N+4 are detected automatically, growing layer by layer through nine-segment upgrades and core overlap merging; non-local-level pivots are marked. Each of the five levels has its own switch. N+1 and above are produced only in multi-level decomposition.
Trend-type decomposition
Trends and consolidations are classified and labelled automatically, giving divergence a valid object of comparison. Two modes are provided: same-level decomposition for execution and multi-level decomposition for analysis.
Divergence detection and hints
Trend divergence and consolidation divergence are detected separately. While a divergence segment is forming, BeiChi and BeiChi_P give early hints; once a trend divergence is fixed, the script prints the Type 1 buy/sell point. Consolidation divergence does not produce a Type 1 point.
Type 1/2/3 buy/sell points
Type 1, 2 and 3 buy/sell points are labelled (1B/1S, 2B/2S, 3B/3S). Superscripts show level, opacity shows strength, and Type 1 points are the most prominent.
Display schemes
Dark and light presets are included plus a custom mode. Pivots, strokes, segments and divergence segments can each have their own colours and line weights.
Handbook
The legend and practical playbooks live on separate pages, so you can come back after subscribing without scrolling this page.
Guide
What every line and mark on the chart means.
Practical guide
Six steps from choosing an operating level to setting stops and targets.
Why it is different
Every criterion comes either from the original text or from an explicit theoretical ruling.
The full structure chain is parsed automatically, removing subjective error
The hard part of Chan theory is not the theory itself but applying it: manual decomposition is subjective, and the same price action gets drawn differently by different people at different times. Following the original definitions, this system implements the full chain bottom-up: containment processing, fractals, strokes, segments (feature-sequence fractals judge termination), pivots, trend types and buy/sell points. Every step follows the definitions strictly, with no simplification and no skipped layers, so the same price action yields the same decomposition at any time, for anyone.
Pivots recurse level by level to build a multi-level trend-type system
The core of Chan theory is level recursion: a pivot's sub-level is a trend type, and a trend type contains pivots, nested layer upon layer. This system grows N-level pivots layer by layer through nine-segment upgrades and expansion, each level strictly built from its sub-level trend types rather than simply stacked segments. The state machine advances in a single chronological pass with rollback and no god's-view preprocessing, faithfully reproducing the recursive logic of “trends must complete” and the level-continuity theorem from the original text.
Dual divergence criteria separate trend from consolidation divergence
The original text explicitly separates trend divergence from consolidation divergence: they compare different objects (trend compares b with c; consolidation compares a with c), and only trend divergence produces Type 1 buy/sell points. This system uses dual criteria—MACD bar area and DIF/DEA zero-axis crossings—strictly distinguishing the two cases and avoiding the common mistake of treating consolidation divergence as a buy signal.
Early BeiChi hints while a divergence segment is still forming
In the original text, “entering the divergence segment” describes a momentum state, not a confirmed buy/sell point. This system prints the BeiChi label the moment divergence conditions are first met rather than waiting for full structural confirmation. In fixed samples, the median lead was about 270 bars with zero anchor displacement in over 80% of cases, so the signal's position is essentially set at first appearance. BeiChi is a hint, not a confirmation, and disappears as structure changes—faithfully reproducing the original semantics that a divergence segment does not always become divergence.
Local-level detection filters cross-level noise with zero parameters
The original text stresses that “a chart's timeframe has no necessary relationship with a pivot's level”, so one chart can hold pivots of different levels. This system decides the local level with zero parameters by whether both DIFF and DEA cross the zero axis within the body (no percentage thresholds), combined with two further checks: the segment count stays within nine and GG/DD do not overlap the previous pivot. Signals that are not local-level are never shown—valid on their own level, but noise to a local-level operator.
Only valid top and bottom fractals are marked
The original text notes that a formed fractal does not always extend into a stroke; relay fractals must be filtered by top-bottom spacing and the alternation principle. This system deploys multi-stage serial filtering between fractal detection and stroke construction, marking only the valid fractals that truly become stroke endpoints. This turns fractal selection from subjective judgement into a deterministic algorithm—the foundation of the zero-parameter, reproducible structure chain.
Who it is for
For people who already understand Chan theory but are tired of inconsistent manual decomposition, who want a deterministic baseline for quantitative checks, and who trade across multiple levels.
Chan theory students
You want to see what fractals, strokes, segments and pivots from the original text look like on real markets, instead of guessing among contradictory subjective drawings.
Experienced chart traders
You understand Chan theory but your manual decomposition differs from day to day and from person to person. You need a deterministic baseline to verify against.
TradingView users
Load it on the charts you already use, on any symbol and timeframe. Five independent level switches sit alongside your other indicators.
For traders who want structural signal support
When trading across levels, you need to know which level structure price is in and treat buy/sell points as levelled structural hints—not instructions.
Plans & pricing
The basic version is free forever and added directly on TradingView. The Pro version is billed monthly, quarterly or yearly and is usually activated within 24 hours after payment. Both versions share the same fractal, stroke and segment algorithms.
Basic vs Pro feature comparison
On the same chart, both versions draw identical strokes and segments. The Pro version adds pivots, trend types, divergence and buy/sell points on top.
FAQ
Do I need a paid TradingView account?
No. Both Basic and Pro versions work on any TradingView account, including free accounts. A paid TradingView plan only lets you run more indicators at the same time.
How soon after payment can I use it?
Orders enter the activation queue right after payment confirmation and are usually completed within 24 hours—watch for the email. Once activated, open the Pro script page to add it.
Which symbols and timeframes does it support?
Any symbol and timeframe with K-line data on TradingView: China A-shares, Hong Kong, US stocks, futures, FX and crypto, from 1 minute to monthly.
Will confirmed structures repaint?
Structures further left will not. Within the most recent few strokes (usually no more than three), stroke endpoints may be rejudged as new bars arrive and the strokes adjust; the last segment also changes until its feature sequence prints a terminating fractal—normal behaviour for a move still in progress. Also, the decomposition start point depends on how much history is loaded: after scrolling left to load more history, the decomposition near the start may differ; with the same history length, results are identical. By design, BeiChi hints disappear as structure changes.
Will the basic version stay free?
Yes—free forever. The Basic and Pro versions use the same fractal, stroke and segment algorithms, so they overlap exactly on the same chart. Use the basic version first to see whether this decomposition fits your judgement before subscribing.
How do refunds work?
Refund policy: unless stated otherwise on the page or required by applicable law, paid fees are non-refundable. You can cancel anytime; after cancellation the current period stays active until it ends and will not renew automatically.
The market has no secrets—only structures you have not read yet
Still Water, One Fold · Read structure out of noise